
In today’s data-driven world, the ability to visualize information effectively is crucial for decision-making and communication. Microsoft Visio 2019 is a powerful tool that allows users to create detailed diagrams and visual representations of data, making complex information more accessible. In this article, we will explore the features of Visio 2019 that enable effective data visualization and how you can leverage them for your projects.
Key Features of Visio 2019 for Data Visualization
1. Enhanced Data Graphics
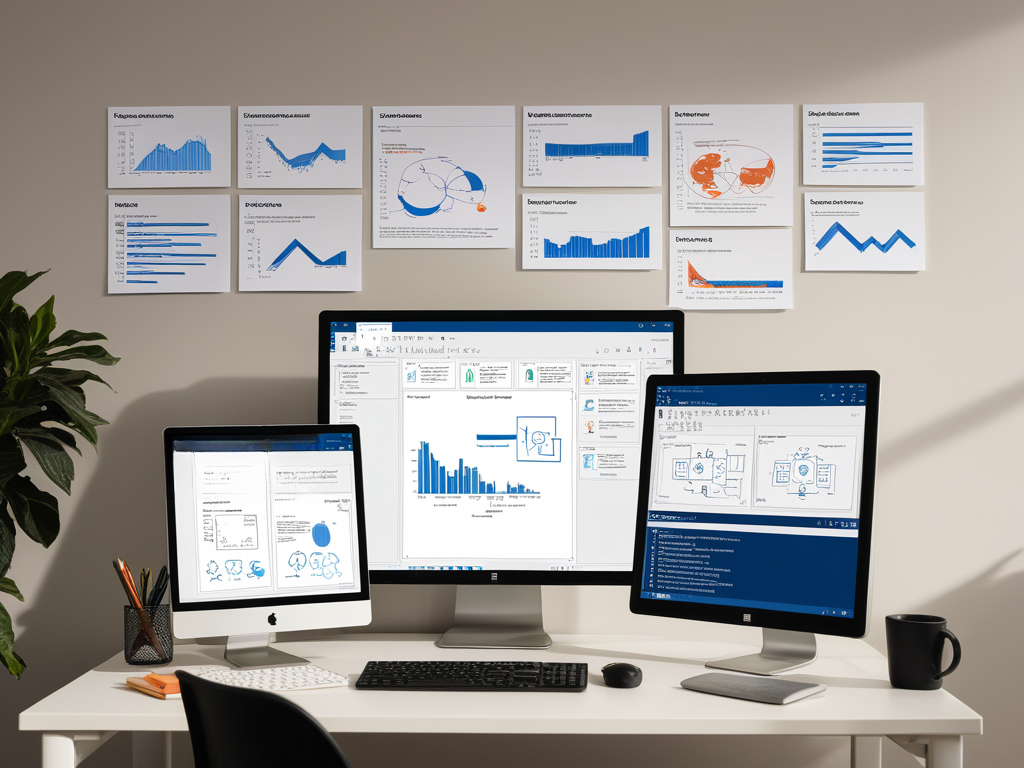
Visio 2019 introduces improved data graphics that allow you to present your data visually within your diagrams. You can link data from various sources, such as Excel spreadsheets or databases, to your shapes. This means that any updates to your data source will automatically reflect in your Visio diagrams, keeping your visualizations current and accurate.
To get started, connect your Visio diagram to a data source by using the “Link Data to Shapes” feature. This integration allows you to display relevant data points, such as sales figures or project statuses, directly on your diagrams.
2. Pre-Designed Templates and Shapes
Visio 2019 comes equipped with a variety of pre-designed templates and shapes tailored for different industries and use cases. Whether you need flowcharts, organizational charts, network diagrams, or floor plans, you can find a suitable template to kickstart your project.
Utilizing these templates not only saves time but also ensures that your diagrams maintain a professional appearance. For example, if you’re creating a network diagram, the pre-designed shapes for servers, routers, and switches can simplify the process and enhance clarity.
3. Data Visualization Tools
The new data visualization tools in Visio 2019 enable users to create compelling representations of their data. Features like color coding, icons, and value bar options allow you to distinguish between different data points visually. This capability helps highlight key information and trends, making your diagrams more informative.
You can customize how data is displayed by changing colors based on value ranges or adding icons to represent specific data conditions. This way, stakeholders can quickly grasp critical insights without delving into detailed reports.
4. Integration with Other Microsoft Products
Visio 2019 integrates seamlessly with other Microsoft products, enhancing its functionality. For instance, you can import data from Microsoft Excel to create data-linked diagrams, or use Microsoft Power BI to visualize your data further.
This interoperability allows for a comprehensive analysis of your data, enabling you to create dynamic reports and presentations. If you want to enhance your data analysis capabilities, consider exploring Microsoft Excel 2019 for powerful spreadsheet tools.
Creating Dynamic Diagrams with Visio 2019
Step 1: Choosing a Template
Begin your data visualization journey by selecting an appropriate template in Visio 2019. Navigate to the templates gallery and choose one that aligns with your project requirements.
Step 2: Linking Data
After selecting a template, link your data to the diagram. Use the “Data” tab to connect your data source, and then drag and drop shapes onto the canvas. You can easily link data to specific shapes by selecting the shape and choosing the corresponding data from your source.
Step 3: Customizing Data Graphics
Once your data is linked, customize the data graphics to suit your preferences. Use the options available in the “Data Graphics” section to adjust how data is displayed on your shapes. Experiment with different colors, icons, and value bars to create visually appealing diagrams.
Step 4: Sharing and Collaborating
Visio 2019 also supports collaboration features, allowing you to share your diagrams with team members. Use the “Share” feature to invite others to view or edit your diagrams, fostering collaboration and ensuring everyone stays on the same page.
The Importance of Effective Data Visualization
Effective data visualization is essential for conveying information clearly and concisely. With Visio 2019, you can turn complex data into understandable visuals that facilitate informed decision-making. Whether you’re presenting to stakeholders, collaborating with team members, or analyzing data trends, Visio 2019 empowers you to visualize your data effectively.
Conclusion
Microsoft Visio 2019 is a powerful tool for visualizing data, enabling users to create professional and dynamic diagrams. With its enhanced data graphics, pre-designed templates, and seamless integration with other Microsoft products, you can transform complex data into meaningful visuals. To maximize your productivity, consider pairing Visio with other Microsoft tools like Microsoft Project Standard 2021 or Microsoft Access 2021 for comprehensive data management.
Explore Visio 2019 today and unlock the potential of your data visualization!
Onebyonesoft Introduction
Onebyonesoft is a certified Microsoft partner specializing in operating systems and office software solutions. As an online retailer specializing in computer software in the United States, Onebyonesoft provides a wide range of Microsoft products to meet your needs. For more details, check out our official page.


 No products in the cart.