
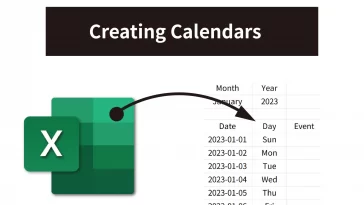
Creating Calendars in Excel: Unconventional Yet Handy Uses
Creating calendars in Excel is not only a breeze for Excel wizards but also a versatile tool for a multitude of unexpected and convenient purposes. In this tutorial blog, we’ll…
Creating calendars in Excel is not only a breeze for Excel wizards but also a versatile tool for a multitude of unexpected and convenient purposes. In this tutorial blog, we’ll…
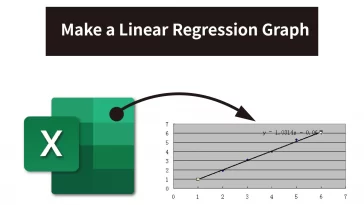
Introduction Linear regression is a statistical technique used to understand and quantify the relationship between two variables. Excel provides a user-friendly way to create linear regression graphs. In this…
Line graphs are a popular Excel chart type to visualize trends and changes over time. While the steps are mostly similar across Windows and Mac, there are some differences to…

 No products in the cart.